Household wealth and its hidden exposure to the housing market
In July of 2019, the Australian Bureau of Statistics announced average Australian household wealth had exceeded the million dollar mark. Unsurprisingly, owner occupied housing was the largest contributor to wealth. Super was the next biggest contributor, followed by other financial assets1.
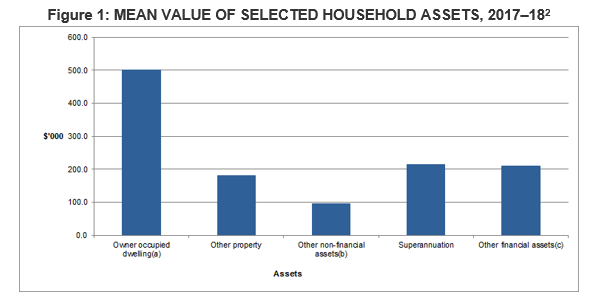
On the surface, it might appear that while average household wealth is most exposed to a housing market decline, superannuation and other financial assets such as equities may provide some diversification.
But it turns out that these assets might not be as diversifying as you think. In fact, average Australian household wealth is even more exposed to a housing crash than the chart above suggests. This is due to the indirect exposure of superannuation, equities and the broader economy to the housing market.
Superannuation and other assets are exposed to the housing market.
Let’s first consider superannuation, the second largest contributor to household wealth. Superannuation savings in Australia make up about 40 per cent of the ownership of Australian equities3. If we dig a little deeper, we find that within the Australian equity market, as measured by the ASX300, banks comprise 25%4, and we know banks are very exposed to mortgages (i.e. the housing market!). Figure 2 below shows the value of mortgages across the big four banks to be equivalent to 80 percent of the economy.

Further, superannuation funds invest in the corporate bond market, of which Australian banks comprise approximately 30% of the issuance6.
In total, Australian superannuation has an approximate 20% exposure to the banking sector through deposits, bonds and equities7.
If we next consider the third largest contributor to wealth (other financial assets), 15% is comprised of direct equities, 26% in deposits, and 7% in offset accounts. Again, we see the connection to banks and therefore mortgages and the housing market.
How does the housing market impact GDP, wages and wealth?
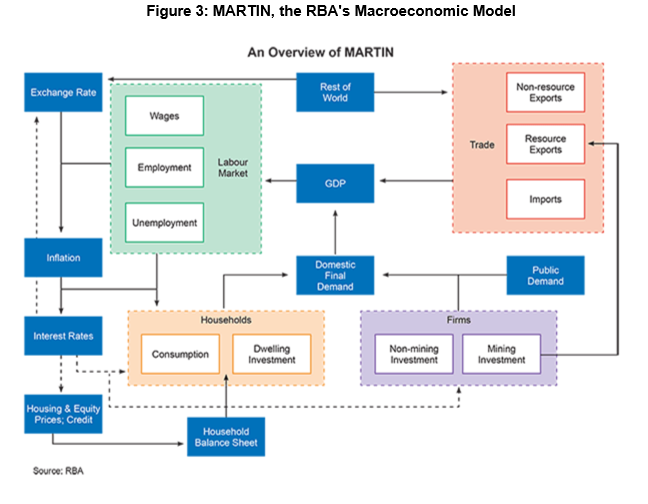
Australian household wealth is not just exposed to the housing market via home ownership, superannuation and equities. Figure 3 below shows the RBA’s MARTIN model which seeks to capture the interrelationships between the variables and mechanisms of the Australian economy8,9. The model illustrates how a shock to GDP (say from a housing crash) would flow through to the labour market, then on to dwelling investment and house and equity prices (household wealth) and eventually back to GDP again. So in short, Australian household wealth is also a function of wages and employment and these variables are a function of GDP, which is also exposed to the housing market!
So how does the housing market impact the labour market (wages and employment) and GDP and just how big is this impact?
It goes without saying that if you work in an industry where income is directly derived from the sale of houses (e.g. real estate agents, builders) then your wealth, via income, is directly exposed to the housing market. But many industries indirectly derive revenues from the housing industry via the supply of services and products. Guy Debelle, RBA Deputy Governer, in his October 2019 speech about “Housing and the Economy” stated:
“The housing market has a pervasive impact on the Australian economy. It is the popular topic of any number of conversations around barbeques and dinner tables. It generates reams of newspaper stories and reality TV shows. You could be forgiven for thinking that the housing market is the Australian economy. That clearly is not the case. But at the same time, developments in the housing market, both the established market and housing construction, have a broader impact than the simple numbers would suggest.”
“..the residential construction sector has linkages to the business services sector through architects, draftspeople and construction engineers, and to the manufacturing sector through steel, bricks, etc..” 10
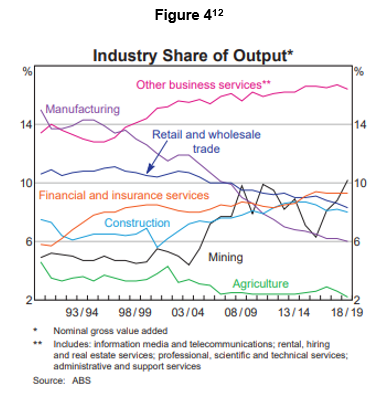
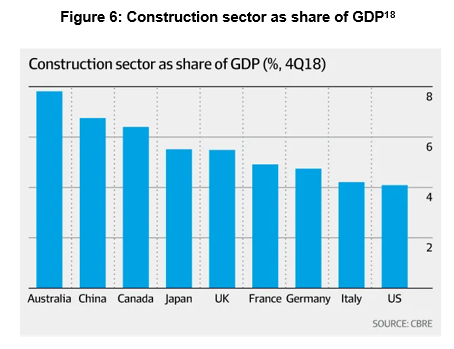
If we put that into numbers, since 1990, housing’s combined contribution to GDP generally averages approximately 24%11 and construction alone contributes between 6% and 8% (Figure 4).
So what might happen if the housing market crashes?
At any point in time it’s likely you’ll find a market commentator who has concerns about a property bubble and is calling a market crash. Whether this is the case or not currently, it is of interest to take a look at some of the key metrics economists use to signal a possible property crash. Of particular interest is the comparison of Ireland’s key metrics prior to its property crash during the GFC and Australia’s metrics today.
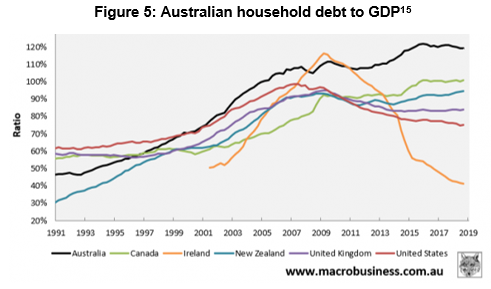
“Australia’s household debt to GDP was 120.5 per cent as of September [2018], according to the Bank for International Settlements, one of the highest in the world. In 2007, Ireland was sitting at around 100 per cent.
At the same time, the RBA puts Australia’s household debt to disposable income at 188.6 per cent. Ireland was 200 per cent in 2007, while the US was only 116.3 per cent at the start of 2008.
RBA figures also show more than two thirds of the country’s net household wealth is invested in real estate. In 2008, that figure was 83 per cent in Ireland and 48 per cent in the US. Meanwhile, 60 per cent of all lending by Australian financial institutions is in the property sector.
In 2007, the International Monetary Fund gave the Irish economy and banking system a clean bill of health and suggested that a “soft landing” was the most likely outcome. [Recently], the IMF said Australia’s property market was heading for a “soft landing” 13.
So what might happen to Australian household wealth if there is a housing market crash in Australia? Obviously, wealth will decline through direct exposure to the housing market. But what about equities and superannuation balances? Given the large exposure of superannuation and the equity market to banks (mortgages) it makes sense to test how the banks would perform in a housing crash.
Australian household debt has been trending upwards (Figure 5) in an environment of very low interest rates and currently, about 20% of mortgage borrowers are in mortgage stress14. The obvious questions are then, how will that debt be serviced when interest rates rise, and if the housing market crashes what will happen to all those mortgages the banks own?
Ratings agency Fitch asked the same questions and did some modelling to identify how the banks might fair in an Ireland style property crash (mortgage defaults of 13% and house prices down 43%). They found that about 40% of bank’s operating profits would be wiped out after including recoveries from mortgage insurances16. A shock of this magnitude to banks earnings would significantly impact the value of Aussie bank shares and flow through to the Australian share market and superannuation balances.
And what about GDP? Some economists have raised red flags about the Australian economy’s reliance on housing, and in particular housing construction.
CBRE’s global chief economist, Professor Richard Barkham recently remarked that a housing price correction in Australia could cause a GDP correction:
“It tends to send a little bit of an alarm bell for me – in the period before the global financial crisis, GDP in construction crept up in the United States to about 10 per cent, and what that means is that a price correction can very quickly translate into a GDP correction,”
“I suspect that the Australian central bank is observing it closely … even a reasonably serious correction now is better than having to pick up the pieces of a major property crash later on.” 17
It’s important however to note many economists have also highlighted how the Australian experience differs from the US and Ireland, and why they think it’s unlikely Australia will experience a housing market crash.
Ireland’s property boom was largely caused by huge capital inflows to the country’s banks, something Australia hasn’t had, Dr Oliver said.
“We have a flexible exchange rate, we’re not part of the euro, we can set monetary policy in response to economic conditions. We’re not like Greece or Ireland. It’s a huge difference.”
He added lending standards in Australia were nothing like as lax as the US, where banks were handing out so-called NINJA loans — no income, no job, no assets — to borrowers who could simply hand the keys back to the bank and walk away.19
But regardless of whether Australia is likely to experience a property market crash on the same scale Ireland and the US experienced during the GFC, Australian household wealth is overexposed to the Australian housing market. This exposure is either direct (home ownership) or indirect via superannuation, the equity market and the broader economy. A more diversified asset allocation would help to protect Australian household wealth from a housing market crash. Diversification could be improved through increased exposure to global assets, taking a more active role in superannuation asset allocation choice and/or decreasing exposure to Australian equities within the financial sector. For example, substituting some Australian direct equity investments for international equities is an easy way to increase diversification without sacrificing returns.
1 https://www.abs.gov.au/ausstats/abs@.nsf/Lookup/by%20Subject/6523.0~2017-18~Media%20Release~Average%20household%20wealth%20tops%20$1%20million%20(Media%20Release)~21
2 (a) Includes stand alone houses, semi-detached and units (b) Includes contents of dwelling and vehicles (c) Includes accounts held in financial institutions, offset accounts, shares, public unit trusts, private trusts, own business (net of liabilities)Source: ABS Survey of Income and Housing, 2017–18
3 https://www.afr.com/wealth/personal-finance/how-much-home-country-bias-is-too-much-20190531-p51tcc
4 Source: Ardea IM
5 https://www.bloomberg.com/graphics/2018-australia-consumer-debt/
6 https://www2.deloitte.com/content/dam/Deloitte/au/Documents/Economics/deloitte-au-economics-corporate-bond-report-2018-030518.pdf
7 https://treasury.gov.au/sites/default/files/2019-03/Challenger.pdf
8 The RBA has also published a Model of the Australian Housing Market https://www.rba.gov.au/publications/rdp/2019/pdf/rdp2019-01.pdf
9 https://www.rba.gov.au/publications/bulletin/2018/mar/meet-martin-the-rbas-new-macroeconomic-model.html
10 https://www.rba.gov.au/speeches/2019/sp-dg-2019-10-17.html
11 HIA
12 https://www.rba.gov.au/chart-pack/pdf/chart-pack.pdf
13 https://www.news.com.au/finance/economy/australian-economy/australia-could-be-first-domino-to-fall-in-next-gfc/news-story/5b115e6c52ca8d9a64fdc0d2ee63ff02
14 https://www.afr.com/companies/financial-services/one-in-five-households-facing-mortgage-stress-despite-low-rates-20191223-p53mfn
15 https://www.macrobusiness.com.au/2019/12/aussies-drowning-in-household-debt/
16 https://www.afr.com/companies/financial-services/major-banks-13-trillion-mortgage-books-stress-tested-by-fitch-20180430-h0zfjn
17 https://www.afr.com/property/australian-economy-exposed-to-two-housing-markets-cbre-global-economist-20190308-h1c61m
18 https://www.rba.gov.au/chart-pack/pdf/chart-pack.pdf
19 https://www.news.com.au/finance/economy/australian-economy/australia-could-be-first-domino-to-fall-in-next-gfc/news-story/5b115e6c52ca8d9a64fdc0d2ee63ff02
This material has been prepared by Ardea Investment Management Pty Limited (Ardea IM) (ABN 50 132 902 722, AFSL 329 828). It is general information only and is not intended to provide you with financial advice or take into account your objectives, financial situation or needs. To the extent permitted by law, no liability is accepted for any loss or damage as a result of any reliance on this information. Any projections are based on assumptions which we believe are reasonable, but are subject to change and should not be relied upon. Past performance is not a reliable indicator of future performance. Neither any particular rate of return nor capital invested are guaranteed.


